|
 |
| |
| |
Advantech's 2012 1H Results Show Healthy Outlook |
|
|
|
|
|
| 2012 H1 Financial Results |
|
|
|
| $USD M |
Y2012 |
|
1H |
| Net Sales |
456 |
| EPS |
0.10 |
| Operating Profit (YoY Growth) |
14.6% |
| ROI |
22.3%% |
| * audited, consolidated |
Advantech’s first half financial results for year 2012 were USD$ 456 M in Net Sales with an operating profit of 14.6% year on year growth. These sales numbers represent only a modest increase compared with the second half of 2011—largely caused by the global economic growth slowdown affected by the continuing European debt crisis. Although the numbers are not what we had targeted, the company operation is still on the right track which is supported by the numbers from our operating data.
|
| 2012 H1 Sales by Region/Sales Force |
|
|
|
| USD$ M |
Y2012 1H |
Growth % |
Total % |
| North America |
129 |
+15% |
29% |
| Europe/ADLoG |
70 |
-11% |
15% |
| Greater China |
122 |
-5% |
27% |
| Asia/Intercon. |
68 |
+13% |
14% |
| Global DMS |
42 |
-29% |
10% |
| Affiliates |
21 |
-16% |
5% |
| Total |
45 |
-2% |
100% |
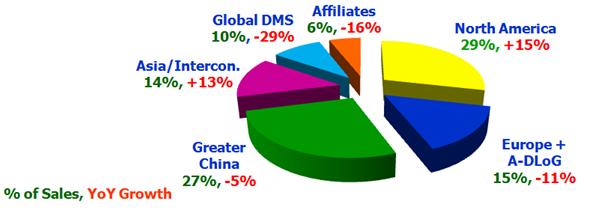
So, looking at our financial reports from the first half of 2012 in detail: 2012 H1 Sales by Region/Sales Force. We see that the TOTAL first half revenue was USD$ 456 M, a YoY
decline of -2%. Breaking it down, we see that the biggest proportion of revenue came from the United States at 129 M, representing 29% of the total revenue and growth of +15%. Followed closely by China with 122 M, representing 27% of the total revenue—a decline of 5%.
Suffering from the European debit impact and a"double-dip" recession, Europe was down to 15% of total revenues—a -11% growth dip.
|
| Asia / Intercon showed pretty good figures with 13% growth which was 15% of global revenue.
|
|
|
|
|
With Global DMS region, sales force revenues declined due to many large customer projects canceled or postponed which caused Global DMS to a -29% revenue dip, representing 10% of global revenue.
Affiliates region also showed signs of decline, with revenue falling by -16%, representing 5% of total revenue.
|
| 2012 H1 Sales by Product - 1/2 - iPlanet Business Group |
|
|
|
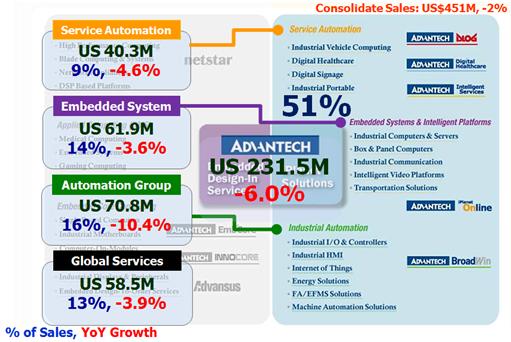
Looking at the iPlanet Business Group sales by product. Service Automation revenue was 40.3M, which accounted for 9% of total revenue, a YoY a decline of -4.6%.
Embedded systems which include IPC & BOX PC, revenues were 61.9M, representing 14% of total revenue, a YoY decline of -3.6%.
Automation Business Group - the highest proportion of iplanet solutions, revenue was
$70.8M, accounting for 16% of total revenues. Due to both Greater China and
United States revenue declining, the overall revenue of automation business
group declined to -10.4%.
Global Services revenue was $58.5 M, 13% of total revenue, a YoY decline of -3.9%.
So the whole iPlanet solutions business group revenue was US 231.5M, accounting for
52% of our total revenues, a YoY decline of -6%.
|
| 2012 H1 Sales by Product - 2/2 - Embedded Design-In Services Group |
|
|
|
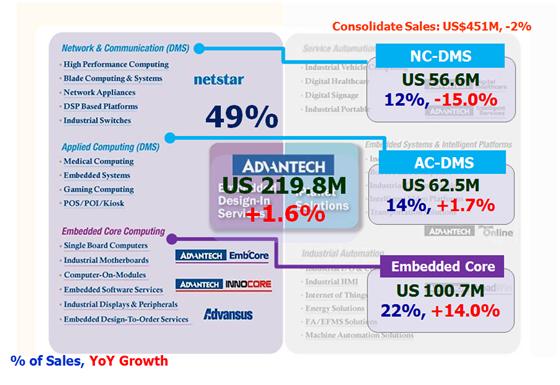
Looking at the Embedded Design-In Services Business Group, NC-DMS revenue was 56.6M, 12% of total revenue, declining by -15% due to cancelled projects and shipments postponed from large telecommunications customers.
AC-DMS revenues were 62.5M, 14% of total revenue, a 1.7% growth.
Embedded Core Business Group, the highest proportion of Advantech, revenue was $100.7M, a YoY increase to 22%, accounting for 14% of Advantech’s total revenues.
So for the entire EDiS business unit, total revenue was USD 219.8M, which accounted for 48% of
Advantech global revenue. This increased 1.6% compared with last year, mainly due to AC-DMS and ECG sustained growth.
|
 |
|
|
|
|